Subdivision KPIs vs. Traditional Metrics: 5 Metrics for Managing Entitlement

Why Traditional KPIs Fail During the Entitlement Phase
In the field of real estate investment, the entitlement phase often determines whether a project succeeds or fails. Yet many investors apply the same metrics as those used for construction projects or rental properties. This approach creates critical blind spots and masks risks before they become costly.
At LandQuire, we have developed a key performance indicator (KPI) tracking system specifically designed for the entitlement phase. Since 2021, we have completed more than 130 projects using these KPIs to ensure transparency, reduce risk, and maximize returns for our 600+ global investors. This article explains why traditional metrics aren’t enough and how our five essential metrics provide real visibility into every stage of the process.
Real estate investors are accustomed to tracking well-established metrics: cash-on-cash return, payback period, and rental yield. These indicators work well for buildings with tenants or completed construction projects. But land entitlement operates on an entirely different basis.
Consider a typical scenario: an investor purchases a piece of land for $2 million with a plan to maximize its value to $6 million. Traditional metrics might show an expected return of 200%, but they don’t capture the critical variables that actually determine whether that return will be achieved. How many months will the approval process take? Will utilities be available without additional investment? Will the municipality require unexpected infrastructure contributions?
Common KPIs such as overall return on investment or the discount rate fail to account for the granularity of the entitlement process. They treat this phase as a black box. When a project is extended by 6 months, the annualized return drops, but investors often do not understand why or how this extension could have been anticipated. This is the difference between a projected return and an actual result—between initial optimism and operational reality.
We have found that investors who rely solely on traditional metrics miss early warning signs: delays in preliminary meetings, requests for planned revisions, or unidentified zoning obstacles. These factors do not appear in an ROI/IRR dashboard. They must be actively tracked month after month, with designated personnel and structured follow-up dates.
That is why we have developed a set of KPIs specific to the entitlement phase. Each metric answers a specific operational question and reveals the actual status of the project rather than simply the financial projection.
The 5 Essential KPIs We Track for Every Project
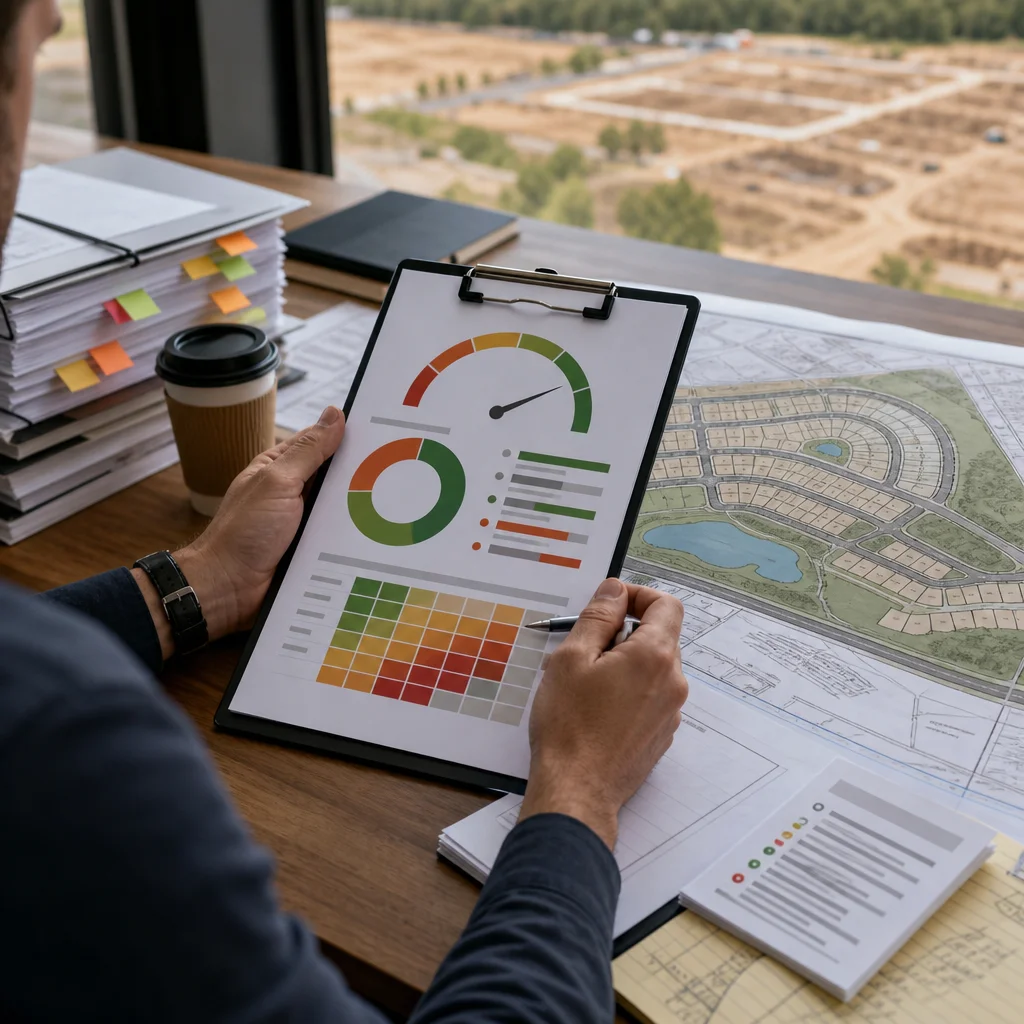
We have identified five indicators that capture the critical aspects of any entitlement project. Together, they provide a comprehensive overview and enable effective management at each stage.
1. Administrative Progress Timeline
This indicator measures the project’s progress through the key stages of pre-application, formal application, revisions, and final approval. We divide this cycle into milestones: pre-application meeting completed, application documents submitted, first revision received, final revisions submitted, and approval granted.
For each milestone, we set an expected date and track actual progress. A two-week delay at one stage is manageable; a delay during the initial review phase may signal potential problems down the line.
2. Actual Cost vs. Budgeted Entitlement Cost
We prepare a detailed budget for all development-related expenses: attorneys’ fees, engineers’ fees, administrative costs, contributions to public infrastructure, and contingencies. Each category is tracked on a month-by-month basis.
Investors are often surprised by the magnitude of cost adjustments. A project with estimated entitlement costs of $150,000 may end up costing $220,000 if the municipality requires an additional traffic study or road improvements. Tracking this metric allows us to quickly identify these variances and adjust the project timeline or cash outflows accordingly.
3. Cumulative Permit Approval Rate
At each phase, several permits and approvals are required. We track the percentage of permits and approvals obtained relative to the total required for the project. This metric provides an immediate overview of the actual status.
A 40% issuance rate after 8 months suggests a healthy pace if the planned timeline is 18 months. A 15% issuance rate at the same stage indicates a possible administrative bottleneck or an unanticipated regulatory change.
4. Review Cycle Duration
This indicator measures the number of days between the submission of documents and the receipt of review comments from the municipality. This cycle can range from 30 to 120 days, depending on the jurisdiction and the local administrative workload.
We track each cycle: if the first cycle lasted 45 days and the second 65 days, this may indicate an increase in complexity or a backlog of cases. This trend allows us to prepare teams for additional reviews and adjust expectations.
5. Compliance Efficiency Index
This index combines the number of revisions requested, the types of comments received (technical, procedural, and public service-related), and the total time to compliance. A project with only two revision cycles and purely technical comments receives a high score; a project with five cycles and substantial revision requests receives a lower score.
This indicator shows whether we are on track to carry out the project effectively, or whether major adjustments to the plans or the municipal engagement strategy are needed.
By combining these five KPIs, we gain a comprehensive picture of the project’s health each month. Investors receive a structured report detailing each metric, trends, and corrective actions, if necessary. This transparency reduces uncertainty and aligns expectations with operational reality.
Administrative Approval Time vs. Actual Time to Compliance
There is a critical distinction that many investors confuse: the theoretical administrative timeline and the actual time required to achieve full compliance.
The administrative timeline is what a municipality’s planning department announces. “Subdivision applications are reviewed within 60 calendar days.” This is a commitment to an administrative timeline, not a guarantee of the outcome.
The actual time required to achieve compliance is more complex. Upon your first submission, the city may reject 30% of your documents as incomplete or non-compliant with local standards. You’ll need to make corrections, re-engage your consultants, and resubmit. This isn’t “administrative” time; it’s compliance time, and it varies greatly depending on the initial quality of your documents and your understanding of local requirements.
At LandQuire, we have compiled data from more than 130 projects on actual timelines. In Florida, a typical residential subdivision project has a stated administrative timeline of 45 days, but the average actual time to full compliance is 4 to 5 months. In Texas, these figures are 60 days and 3 to 4 months, respectively. The difference lies in the number of review cycles and the extent of the technical adjustments required.
We actively track two key dates for each milestone: the projected administrative date (based on public announcements) and the projected compliance date (based on our historical data and project-specific adjustments). Investors receive both dates, along with an explanation of the expected difference.
Real-world example: A project in Texas receives administrative approval after 70 days, but the team discovers that one of the conditions of approval requires an additional geotechnical study costing $35,000 and taking six weeks to complete. This delay was not factored into the initial administrative timeline. To avoid this surprise, we factor these contingencies into our compliance projections in advance.
What we can do for you: When evaluating an entitlement opportunity, ask the project manager not only for the timeline announced by the municipality, but also for the actual time taken in comparable projects. This distinction can shift your IRR by 2 to 5 percentage points.
Projected Cost of Ownership vs. Smart Expense Management
Entitlement budgets are rarely accurate at the time of the initial signing. What we have discovered is that significant variances are not random; they follow predictable patterns and can be managed strategically.
Entitlement costs include several categories: legal and technical fees (30–40% of the budget), municipal administrative fees (10–15%), public infrastructure contributions (20–35%), and a contingency reserve (15–20%).
The category that varies the most is infrastructure contributions. A subdivision of 50 lots may initially be budgeted at $100,000 in contributions, but if the municipality determines that the existing roads cannot handle the additional traffic, that contribution may rise to $250,000. This is the hidden cost that most projection models underestimate.
At LandQuire, we use a three-tiered approach to budgeting:
Base-case budget: based on municipal standards and local historical data. Represents the likely cost if no major challenges arise.
Conservative scenario budget: Add a 25–35% buffer to account for requests for technical revisions, additional studies, or minor regulatory changes.
Impact scenario budget: Includes major contingencies such as road improvements, in-depth environmental studies, or substantial plan modifications.
Investors receive all three scenarios from the outset. This stands in stark contrast to traditional approaches, which present only a “best-case” scenario.
As part of our monthly monitoring, we compare actual expenses to all three budgets. If actual costs approach the conservative budget, we implement management strategies: negotiating more rigorously with consultants, optimizing plans to reduce municipal requests, or reassessing the schedule to reduce extended project management costs.
We have observed that this granular approach reduces uncontrolled cost overruns by an average of 40% compared to a reactive budget management approach.
Permit Approval Rates: Risk Assessment Methodology
The permit approval rate is a metric that is often overlooked until a permit is denied. We use it as a proactive risk indicator.
Each permit or approval required for a project is categorized by risk:
Low risk: routine administrative permits (property numbering, plan registration), which are generally approved within 15–30 days without revisions.
Moderate risk: technical permits with clear requirements (approval of the subdivision plan, utility compliance certificate), typically approved within 45–90 days, often after one revision.
High risk: discretionary approvals (zoning exemptions, special plan approvals, development agreements), which generally require 2–3 review cycles and 90–180 days.
For each project, we calculate the total percentage of permits by risk category. A project with 70% low-risk permits and 20% medium-risk permits has a very different risk profile than a project with 40% high-risk permits.
As part of our monthly monitoring, we track the approval rate not only in total numbers but also by risk category. If all low-risk permits are approved but only 10% of high-risk permits are approved after three months, this indicates that major obstacles have not yet been encountered. We can then adjust our communications with the municipality, engage additional stakeholders, or develop alternative strategies.
Example: A project required a “routine” zoning variance. After a preliminary meeting, we discovered that the city council had recently changed its policy on residential densities. What we had classified as a medium risk turned into a high risk. Instead of a 60-day timeline, we rescheduled for 150 days and engaged in more in-depth negotiations with elected officials. This reclassification preserved the project’s overall timeline by anticipating the obstacle rather than discovering it in the midst of a crisis.
Our Differentiated Approach to Maximizing Value
Most entitlement teams focus solely on obtaining approvals. Our approach incorporates value optimization into every entitlement decision.
When designing a subdivision, there are generally several possible legal configurations. A 20-acre parcel can be divided into 40 lots of 0.5 acre, or 50 lots of 0.4 acre, or 35 lots of 0.57 acre with green space requirements. Each configuration has a different impact on entitlement costs, the timeline, and the final value for a developer-purchaser.
We evaluate each configuration based on three criteria: regulatory feasibility, licensing costs, and market appeal to a developer. The highest-density configuration is not always the best option if it extends the process by 6 months or increases infrastructure costs by $200,000.
At LandQuire, we use an integrated financial model that tests 5–8 different scenarios before submitting the documents to the municipality. For each scenario, we calculate:
- Total number of lots or units
- Estimated eligibility costs
- Estimated Compliance Timeline
- Estimated value for a developer (based on comparable properties and market data)
- Resulting IRR for the investor
The optimal configuration generally balances maximizing the number of lots with minimizing regulatory hurdles and associated costs. A project that adds 10 additional lots but costs an extra $150,000 in contributions and delays the schedule by 4 months may reduce overall returns rather than improve them.

This optimization goes unnoticed by most investors, but it has a direct impact. In our portfolio, this approach increases the average IRR by 2–3 percentage points compared to a simple “maximum density” strategy.
Competitive Advantages of Our KPI Tracking System
Our KPI tracking system offers several benefits that fundamentally change the way investors manage risk and returns.
Structured Monthly Transparency
Each investor receives a monthly report highlighting the five key KPIs, trends, deviations from the plan, and ongoing actions. This isn’t just a vague email; it’s a standardized, verifiable document that you can compare month to month.
Early Detection of Problems
Because we actively monitor review cycle times, permit approval rates, and cost trends, we identify obstacles 4 to 8 weeks before they become critical. This gives us time to adjust our strategy rather than wait for a crisis to occur.
Continuous Optimization
Instead of treating a project as a linear process from start to finish, our KPIs allow us to optimize at every stage. If the review period gets longer, we can improve the quality of our submissions. If costs start to pile up, we can negotiate or adjust the plan. This flexibility improves results.
Comparability Across Projects
Because we use the same metrics across all 130+ projects, we have built a robust historical database. We know that high-risk projects in Florida typically take 5–6 months longer than those in Texas. We know that infrastructure contributions vary by an average of 15% from initial budgets. These empirical insights directly inform the planning of future projects.
Clear Financial Accountability
When you invest $500,000 in a project, you need to know where every dollar is spent and whether the project is on track. Our KPI system establishes a clear chain of accountability. If costs exceed the budget, you’ll see it in your monthly report, along with a detailed explanation.
Why Choose Our Expertise in Entitlement Management
Land entitlement is a specialized field. It combines regulatory expertise, municipal relations, strategic planning, and financial project management. These are not skills that a general real estate team typically possesses.
Our teams at LandQuire are made up of experts dedicated to this phase. We have built a network of relationships with municipal planning departments in key markets in Texas and Florida. We understand the preferences of various city councils, local regulatory trends, and how to structure our proposals to secure approval.
Most importantly, our KPI-driven approach means you’re never left in the dark. You’re not investing in a black box and hoping for the best. Every month, you know exactly where your project stands, what risks remain, and what timeline and returns to expect.
With more than 600 global investors already accessing our opportunities and a 100% success rate in securing entitlements, investors choose LandQuire because we deliver proven results and transparent management.
Our best-in-class entitlement process has been refined over the course of more than 130 projects. Every phase, every metric, and every report has been designed to protect your capital and maximize your return.
If you’re looking to invest in off-market real estate with a target IRR of 20–35%, without the risks associated with construction or property management, our LandQuire Portfolios offer exactly that. Land entitlement isn’t just a side business for us—it’s our core business.
Your next step: Contact us to discuss how our KPI-based entitlement management approach can secure and accelerate your returns.